Speech Communication Group
Exploratory Visualizations
Most gesture research articles show gestures as video snapshots, tracings of video snapshots, or time-aligned blocks as seen in the multimedia annotation software like ELAN or ANVIL.
Custom exploratory data visualizations allow us to view our data in different ways to give insights into the data and better communicate the patterns we see that support our hypotheses.
We have growing set of visualizations to visually investigate patterns of multimodal alignment. These visualizations are built using a combination of HTML, CSS, Perl, Processing (see processing.org ), hand illustration, graphic design, and video manipulation.
Gesture Phases
Our stroke-defined gestures have a central gestural stroke surrounded by the optional gesture phases of preparation, holds, relaxation (also known as recovery) and a static relaxed phase.

Multimodal Display
June 2021
This interactive visualization shows the transcript, screenshots for each word, silence durations, and regions where each hand is not moving. Hover over each word for a screenshot of the video at the start time of the word. Underneath the screenshot, the start time (in seconds) is on the left and the end time is on the right. Silences where both hands are not moving are colored in a dark yellow. When words have a top border color, it means that the word overlaps with an annotation indicating that the right hand is not moving. The specific color of the border refers to where the hand is in relation to the body. Orange means near the waist, and dark brown means by the speaker's side. The grayed patterned background over a word means that the speaker is occluded.
Phases and intonations
August 2019
These show the syllables with the accented ones in yellow, the gesture phases with the strokes in yellow, and corresponding trajectory paths drawn inside the phases. The gesture phases with the top left corner rounded is the preparation phase, and the ones with the top right corner rounded are the relaxation/recovery phase. The illustrated trajectory shape shows the path of the entire grouping in white, in the direction of the arrow, and the trajectory of the phase in purple. This is coded in Processing, with the trajectory paths added in using Adobe Illustrator.


Trajectory Paths
April 2018
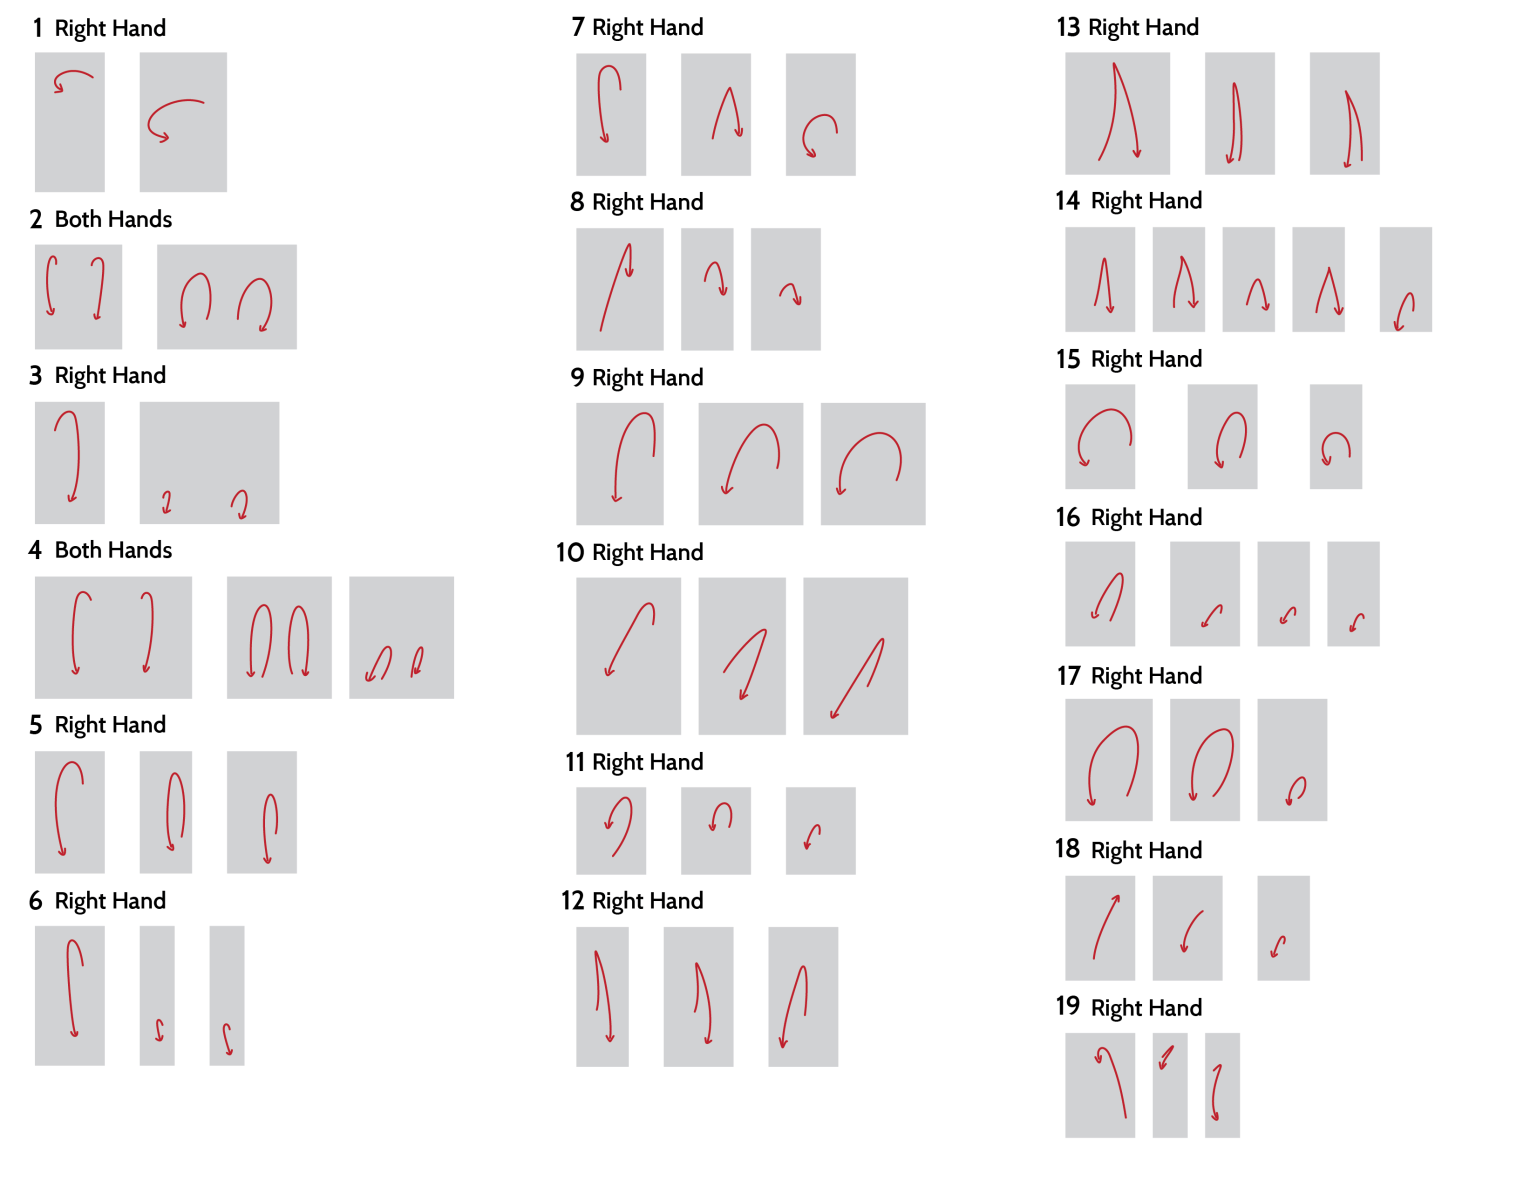
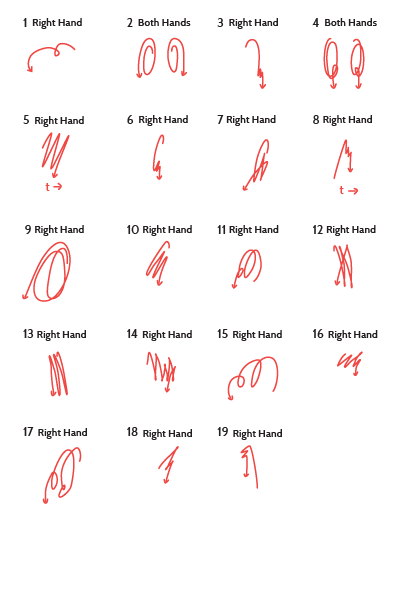
This visualization shows the similarity in trajectory paths for successive strokes within a perceived group. Here are 19 sample groups, showing individual strokes. The gray boxes denote a single stroke, and can be bimanual. Some trajectory paths appear to include the preparation phase, but this is only because the high speed of the movement makes them beat-like and the goal of this visualization includes investigating that aspect.

This image below shows the trajectory path shape of the entire duration of the perceived gesture group, showing a consistency of form amongst the individual gesture strokes within the group, and where they are in space, whereas the image above separates them out.

Sorting Movement Patterns
September 2020
One of the challenges of comparing communicative events is the limitation of seeing only one video clip at a time. What if we can see multiple movements at a single time? Doing so opens the possibility of revealing movement patterns of a speaker or topic, that we may not have predicted in our annotation schema. This exploratory visualization method supports research work.
-
How to set this up for your research
Overview
This method uses annotation labels of a single tier, and creates multiple video clips using the start time and end time of each annotation. These clips are converted into *.gif files (no audio) and then imported into Google Slides. Within a slide, the clips can be rearranged according to your research interests.
Tools
All references to tools will be based on a MacOS environment. You will need:
- • a *.csv file of a single annotated tier,
- • the video file to be clipped,
- • basic knowledge of using Terminal,
- • and access to Google Slides.
Set up Terminal tools
Launch the Terminal app
If you don't have Homebrew, install it. Paste the script below in a macOS Terminal or Linux shell prompt. Learn more about Homebrew »
/bin/bash -c "$(curl -fsSL https://raw.githubusercontent.com/Homebrew/install/HEAD/install.sh)"Next, use Homebrew to install ffmpeg. This is a tool that can clip and convert video.
brew install ffmpegYou'll also need gifsicle to turn your videos into *.gif files.
brew install gifsicleTurn your annotations into video clips
Download, unzip, and read the instructions on this shell file »
Turn your video clips into gifs
Next, turn all the video clips in that folder into *.gif files.
for i in *\.mp4 ; do ffmpeg -i $i -s 360x640 -pix_fmt rgb24 -r 10 -f gif - | gifsicle --optimize=3 --delay=3 --loopcount=0 > ${i%%.*}.gif ; done
Time-Aligned Gesture Phases
November 2015
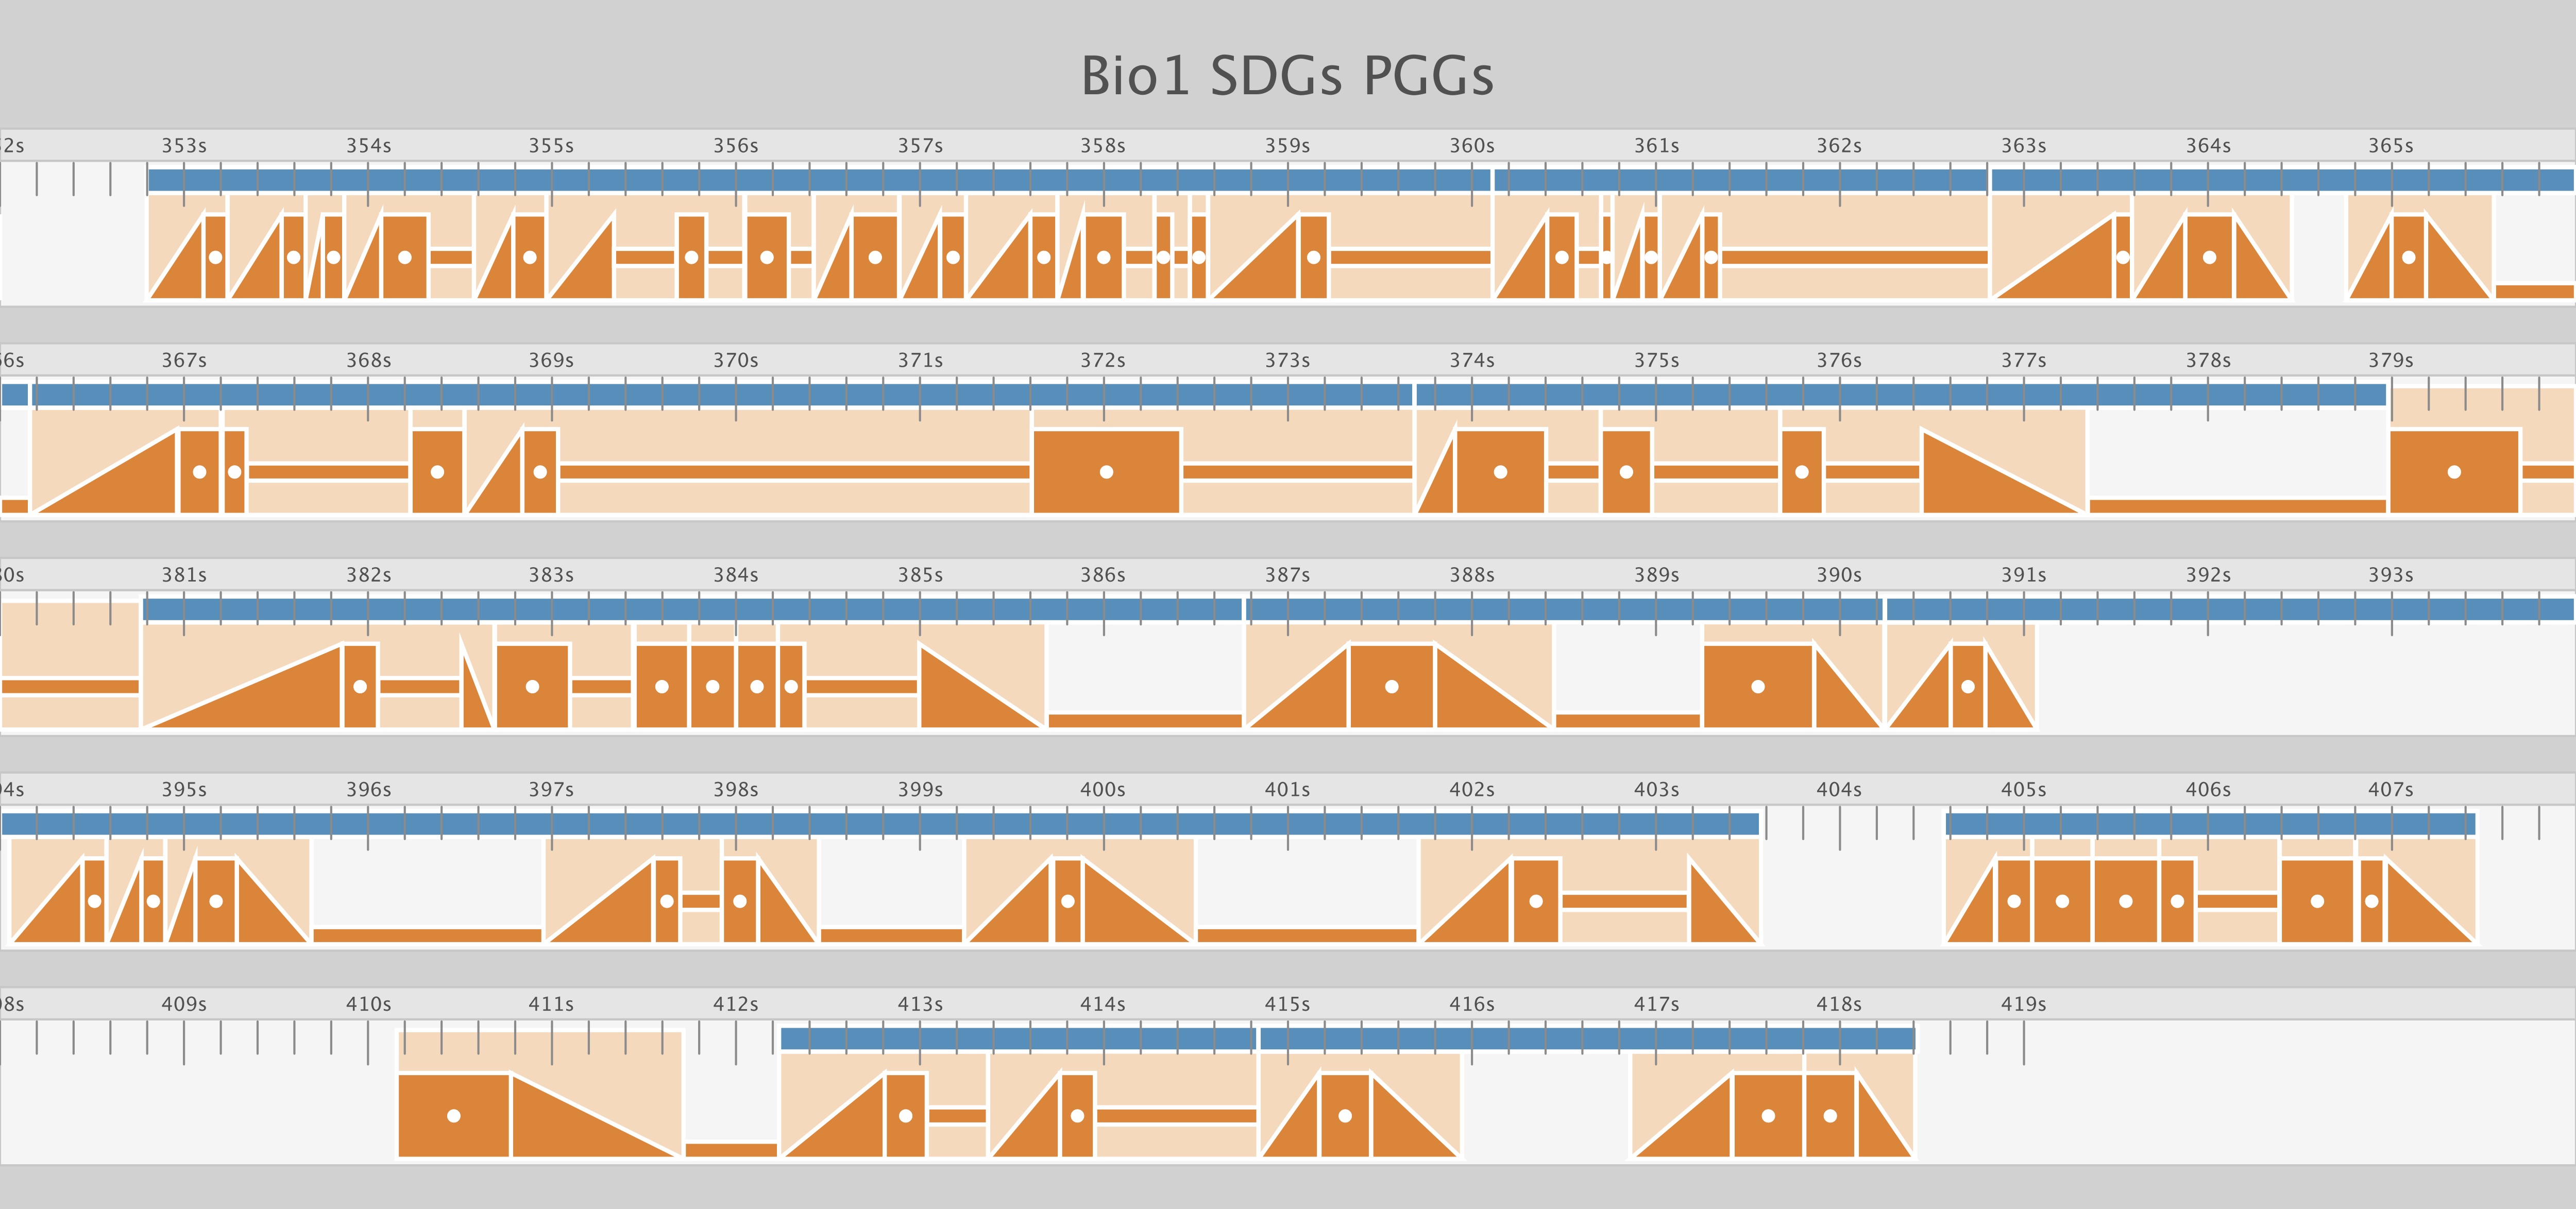
In this visualization, the gesture phases are simplified to time-aligned polygons. The preparation phase is an upwards sloping triangle, the static phases of holds and relaxeds are long rectangles, and the relaxation or recovery phase is a downwards sloping triangle. The stroke is a large rectangle with a small circle in the center to draw the eyes to focus on them. The blue bars on top show preliminary grouped gestures, while the light orange background behind each set of phases show the stroke-defined gesture. This is coded in Processing.

Discourse and Timing
October 2015
This visualization shows the perceptual gesture groupings in the text. The text below takes the transcribed syllables–which is why most words appear misspelled–and checks whether the syllable is in a grouping (alternating colored red and teal) or in a region of video where the speaker is occluded by a presentation slide (grey). Since this is an HTML file, there is some degree of interactivity. You can hover over each syllable to get information about the location of the syllable in the video, and which grouping it overlaps with. There is a 99 millisecond margin of error, which is the equivalent of 3 frames of video in a 30fps video. The data is exported from ELAN as a tab-delimited text file. This is coded in Perl to write an HTML file.
Hand Tracking Video
February 2013
We explored the possibility of using the velocity of the hands to help easily label gesture features such as different phases, the curvature of the motion, among other possibilities. Using ProAnalyst, we tracked the index finger on both hands, subtracted the body movement, extracted the positioning data. The data is transformed in Processing code for the visualization, with added a line of code to turn each 1/30 second frame into an image. Afterwards I used a time-lapse utility to turn it into a video.